Data Analysis with Balansor
This guide explains how to process and analyze survey data using Balansor, Askalot's statistical analysis service. Balansor enables you to extract survey responses, apply post-stratification weighting, evaluate data quality, and export results in multiple formats.
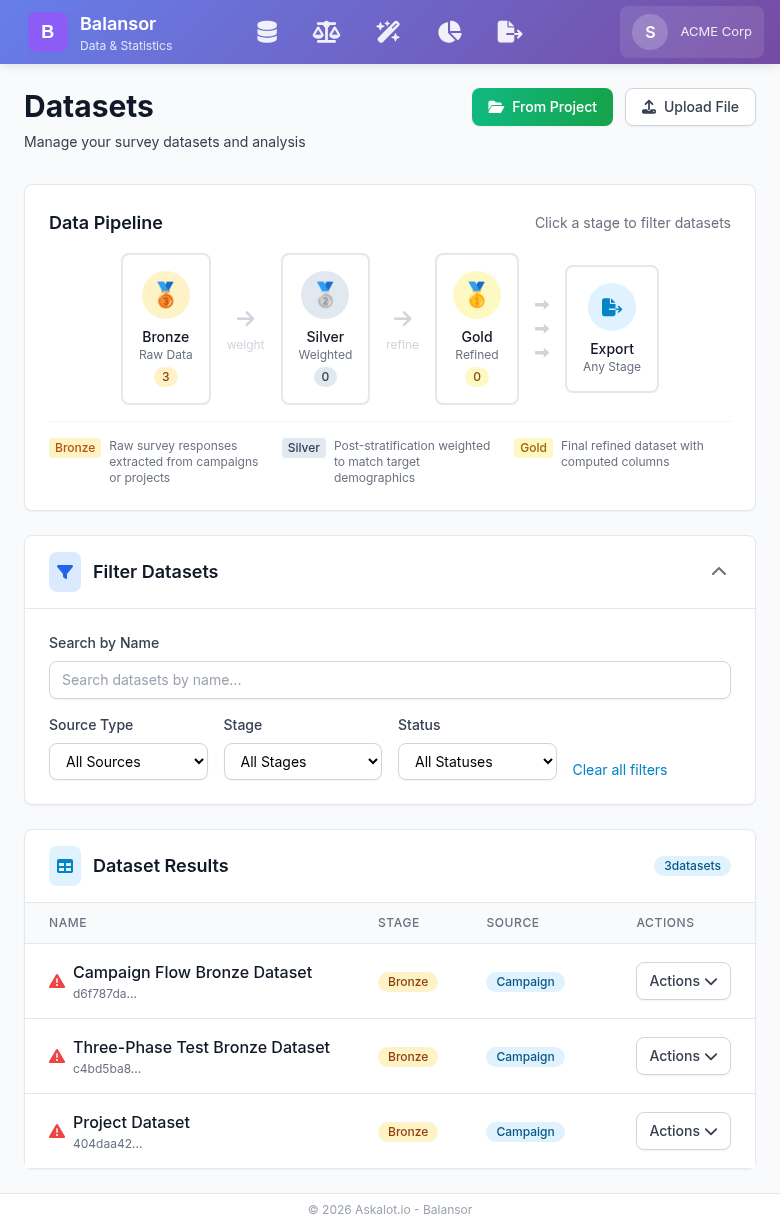
The Balansor dashboard showing the data pipeline (Bronze → Silver → Gold → Export) and dataset management interface.
Core Concepts
The Medallion Architecture
Balansor organizes datasets using a medallion architecture with three progressive stages:
🥉 Bronze (Raw Data)
- Survey responses extracted from campaigns or by questionnaire
- No statistical corrections applied
- Preserves original response values
- Foundation for all downstream processing
🥈 Silver (Weighted Data)
- Post-stratification weights applied via raking algorithm
- Corrects sampling bias to match target demographics
- Includes
_weightcolumn for statistical analysis - Maintains lineage to source Bronze dataset
🥇 Gold (Refined Data)
- Final dataset ready for publication or delivery
- May include computed columns, aggregations, or transformations
- Supports field transformations (rename, reorder, delete columns)
- Supports semantic clustering of open-ended text responses into quantitative indicator columns
- Highest quality tier for client delivery
- Maintains full lineage to Silver and Bronze sources
Why Medallion Architecture?
This staged approach provides:
- Reproducibility: Raw data preserved; processing steps documented
- Flexibility: Export from any stage based on client needs
- Quality Assurance: Progressive refinement with validation at each stage
- Auditability: Full lineage from raw responses to final deliverables
Getting Started
Accessing Balansor
Navigate to Balansor from the main navigation menu or directly via your tenant URL:
Understanding the Interface
Balansor's navigation follows the natural pipeline progression:
| View | Purpose |
|---|---|
| Extract | Create Bronze datasets from campaigns or file uploads |
| Weighting | Apply post-stratification weights (Bronze → Silver) |
| Refine | Transform datasets into Gold — field editing, computed fields, and semantic clustering |
| Export | Download datasets in any format from any stage |
| Quality | Evaluate sample representativeness and response quality |
Dataset Bundles
Balansor organizes datasets into bundles — groups of related datasets linked by lineage. A bundle starts with a Bronze dataset and includes all Silver and Gold datasets derived from it.
Bundle: "Q1 Customer Survey"
├── 🥉 Bronze  (100 rows, extracted 2026-03-01)
├── 🥈 Silver  (100 rows, weighted 2026-03-02)
├── 🥈 Silver  (100 rows, different strategy, 2026-03-05)
└── 🥇 Gold    (100 rows, refined from Silver #1, 2026-03-03)
Every page in Balansor shows a bundle selector — a grid of cards representing your dataset bundles. Each card displays:
- Bundle name (from the root Bronze dataset)
- Stage indicators — filled circles for existing stages, empty for missing
- Row count and creation date
Selecting a bundle scopes the page to that bundle's datasets. For example, on the Weighting page, selecting a bundle auto-selects its Bronze dataset for weighting. On Export, only the bundle's datasets are shown (with a toggle to show all).
Bundles are automatic
Bundles are built from existing lineage — the source_dataset_ids chain. You don't create bundles manually. Every Bronze dataset starts a new bundle, and derived Silver/Gold datasets join their parent's bundle automatically.
Creating Datasets
From Projects (Questionnaire-Centric)
Extract survey responses from completed campaigns within a project using a three-step wizard:
- Navigate to Extract from the main menu
- Click "From Project"
- Step 1 — Select Project: Choose the source project
- Step 2 — Select Questionnaire: Choose which questionnaire defines the dataset schema (columns). If the project has only one questionnaire, it is auto-selected
- Step 3 — Select Campaigns: Choose which campaigns to include (all are selected by default). If interviewer ad-hoc surveys exist for this questionnaire, an option to include them appears
- Configure options:
- Dataset Name: Descriptive name for the Bronze dataset
- Include Demographics: Add respondent age, gender, location from profiles
- Click "Create Dataset"
The questionnaire defines the column schema — all outcome columns are derived from the QML structure, guaranteeing consistent columns regardless of which campaigns are included.
The new Bronze dataset appears as a bundle in the pipeline overview.
From File Upload
Upload an existing dataset file:
- Navigate to Extract → "Upload File"
- Select a CSV, Excel, SPSS, or JSON file
- The file is stored as a new Bronze dataset
Dataset Properties
Each dataset includes:
| Property | Description |
|---|---|
| Stage | Pipeline position (Bronze, Silver, Gold) |
| Rows | Number of response records |
| Source Type | Origin (campaign, project, extraction) |
| Has Weights | Whether weight column exists |
| Quality Score | Overall representativeness metric (if applicable) |
| Lineage | Source dataset IDs for Silver/Gold datasets |
Post-Stratification Weighting
What is Raking?
Raking (iterative proportional fitting) adjusts survey weights so that weighted marginal distributions match known population targets. This corrects sampling bias that occurs when survey respondents differ from the target population.
Example: If your survey has 60% female respondents but the target population is 50% female, raking assigns higher weights to male responses and lower weights to female responses.
Applying Weights
- Navigate to Weighting from the main menu
- Select a bundle — the Bronze dataset is auto-selected
- Choose your Target Demographics Source:
- Project Strategy: Use the sampling strategy assigned to the dataset's project
- Organization Strategy: Select from organization-wide sampling strategies
- Create New: Link to Targetor to define a new strategy
- Review strategy factors and target distributions
- Click "Apply Raking & Create Silver Dataset"
Target Demographics Sources
Project Strategy
If your Bronze dataset came from a campaign within a project that has a sampling strategy assigned, this strategy's demographic targets are automatically available.
When to use: Your project already has defined demographic targets that guided respondent selection.
Organization Strategy
Select from sampling strategies shared across your organization (strategies without project assignment).
When to use:
- The dataset's project has no assigned strategy
- You want to apply a different set of targets than originally planned
- You're using a standard demographic profile across multiple projects
Create New Strategy
If no suitable strategy exists, create one in Targetor:
- Click "Create New Strategy" to open Targetor
- Define target distributions for each demographic factor
- Save the strategy (organization-wide or project-specific)
- Return to Balansor and refresh the strategy list
Weighting Results
After successful raking, you'll see:
| Metric | Description |
|---|---|
| Converged | Whether the algorithm reached stable weights |
| Iterations | Number of raking iterations performed |
| Mean Weight | Average weight (should be ~1.0) |
| Design Effect | Variance inflation due to weighting |
| Weight Range | Min and max weights assigned |
| Effective Sample Size | Equivalent unweighted sample size |
Interpreting Design Effect
A design effect of 1.5 means your effective sample size is 67% of your actual sample size. Higher design effects indicate more extreme weighting adjustments.
Quality Analysis
Balansor provides two complementary quality dimensions, accessible from the Quality page:
- Sample Representativeness — Does our sample look like the target population?
- Response Quality — Are survey questions producing informative, diverse responses?
Sample Representativeness
Representativeness metrics compare your dataset's actual demographics against the targets defined in a sampling strategy — RMSE, MAE, Chi-Square, Max Deviation, and a Composite Quality Score. See the Quality Metrics Reference for definitions, formulas, and interpretation thresholds.
Viewing Representativeness
- Navigate to Quality from the main menu
- Select a bundle — the Bronze dataset is auto-selected and quality metrics load
- The Sample Representativeness tab shows per-factor breakdowns with actual vs. target distributions
- If Silver datasets exist in the bundle, view side-by-side improvement from weighting
Improving Representativeness
If quality scores are low:
- Check respondent demographics: Missing demographic data reduces matching capability
- Review strategy targets: Ensure targets are achievable with your respondent pool
- Consider broader factor definitions: Combine small categories with few respondents
- Increase sample size: More respondents enable better matching
Response Quality
Response quality metrics evaluate survey responses themselves — independent of sampling strategy. Key metrics include Normalized Entropy (answer diversity), Straightlining Score (identical-answer patterns), Cronbach's Alpha (internal consistency), Acquiescence Bias Index, Speeder Detection, and Multi-Flag Aggregation. See the Quality Metrics Reference for definitions, formulas, and interpretation thresholds.
Viewing Response Quality
- Navigate to Quality from the main menu
- Select a Bronze or Silver dataset
- Switch to the Response Quality tab
- Review aggregate summary cards, per-question metrics table, straightlining detection, and internal consistency
Response quality metrics are also shown in a compact card on each dataset's detail page.
Refining Datasets
The Refine page combines two operations under one roof: field transformation (rename, reorder, delete, compute) and semantic clustering of open-ended text. Both produce Gold datasets.
Field Transformation
- Select a bundle, then choose a source dataset (Silver or Bronze)
- The Field Transformation tab shows all columns with drag handles
- Rename columns by clicking their name
- Delete columns with the X button (restorable until you create the Gold)
- Reorder by dragging fields
- Add computed fields (see below)
- Name the Gold dataset and click "Create Gold Dataset"
Computed Fields
Computed fields let you derive new columns from existing survey data before export. Balansor leverages QML metadata (option labels, question types, group structure) to auto-suggest operations and pre-fill configurations — something generic tools like SPSS cannot do automatically.
Three operation types are available:
Recode (Top/Bottom Box)
Collapses an ordered scale into groups. The most common operation in survey data preparation.
| Mode | Output | Example |
|---|---|---|
| Top Box | Binary 0/1 | Top 2 of a 5-point scale → q_satisfaction_topbox |
| Top/Bottom Box | Ternary ½/3 | Bottom 2 = 1, Middle = 2, Top 2 = 3 |
| Reverse Code | Numeric | Flips scale (1→5, 2→4, ...) for negatively worded items |
When you select a column, Balansor reads its QML labels (e.g., {1: "Strongly Disagree", ..., 5: "Strongly Agree"}) and shows which values fall into each box. No manual codebook lookup needed.
When to recode
Top/Bottom Box is standard practice for reporting Likert-scale results. It answers "what percentage of respondents agree?" — a simpler story than "the mean was 3.7 on a 5-point scale." Reverse coding is a prerequisite when you plan to combine positively and negatively worded items into a composite score.
Scale Construction
Combines multiple sub-items into a single composite score using mean or sum aggregation.
Balansor auto-detects QuestionGroup siblings — columns that came from the same matrix or battery question (e.g., q_sat_0, q_sat_1, q_sat_2) — and suggests combining them.
| Setting | Description |
|---|---|
| Method | Mean (interpretable on original scale) or Sum |
| Min Valid | Minimum non-null items per row — rows with fewer get NaN. Default: N-1 (allows 1 missing) |
| Reverse Columns | Toggle per item for negatively worded sub-items |
Before creating the scale, click "Check" to see Cronbach's alpha — a measure of internal consistency. Alpha above 0.7 indicates the sub-items reliably measure the same construct; below 0.5 suggests they may not belong together.
Min Valid and missing data
The min-valid threshold follows the SPSS MEAN.n() convention. If a respondent skipped 2 of 5 items and min-valid is 3, the scale is computed from the 3 answered items. If they skipped 3, the row gets NaN instead of a misleading average from too few responses.
Count Selections
Counts how many options a respondent selected in a multi-select (Checkbox) question.
Balansor auto-detects Checkbox question groups and suggests them. Three counting modes:
| Mode | Output | Example |
|---|---|---|
| Count non-zero | Integer | Selected 3 of 8 products → products_count = 3 |
| Count matching | Integer | 2 items rated ≥ 4 → n_satisfied = 2 |
| Any flag | Binary 0/1 | At least one complaint → any_complaint = 1 |
Auto-Suggestions
When you select a source dataset, Balansor analyzes the QML column schema and shows quick-add suggestions below the computed fields list. One click adds a pre-configured computed field. Suggestions appear for:
- Likert scales with 4+ options → Top/Bottom Box recode
- QuestionGroup batteries with 3+ sub-items → Scale construction
- Checkbox question groups → Count selections
Semantic Clustering
The second tab on the Refine page handles text response clustering — transforming open-ended Textarea responses into quantitative theme indicators. See the dedicated Semantic Clustering guide for details.
Exporting Data
Export from Any Stage
A key benefit of the medallion architecture is the ability to export from any stage:
| Stage | Use Case |
|---|---|
| Bronze | Raw data for custom analysis or archival |
| Silver | Weighted data for statistical software |
| Gold | Final deliverable for clients |
Export Formats
Balansor supports multiple export formats:
| Format | Extension | Best For |
|---|---|---|
| CSV | .csv |
Universal compatibility, Excel, Python, R |
| Excel | .xlsx |
Microsoft Excel with formatting |
| SPSS | .sav |
SPSS/PSPP with variable labels |
| Parquet | .parquet |
Big data pipelines, efficient storage |
Export Process
- Navigate to Export from the main menu
- Select a bundle to scope the dataset list (or toggle "Show all datasets")
- Optionally filter by stage (Bronze, Silver, or Gold)
- Click on a dataset to select it
- Choose export format
- Configure options:
- Include Metadata: Add data dictionary and processing notes
- Include Weights: Export weight column (Silver/Gold only)
- Custom Filename: Override default naming
- Click "Export" to download
Export Options
Include Metadata: Adds a supplementary sheet or file with:
- Column descriptions
- Processing history
- Source information
- Quality metrics
Include Weights:
For weighted datasets, exports the _weight column used for statistical analysis.
Workflow Examples
Standard Survey Analysis
- Extract: Create Bronze dataset from completed campaign
- Weight: Select the bundle, apply project strategy → Silver created
- Refine: Add Top/Bottom Box recodes for key satisfaction questions → Gold created
- Review: Check quality metrics — bundle selector auto-loads Bronze quality
- Export: Select the bundle, download Gold as SPSS for client delivery
Composite Score Workflow
- Extract: Create Bronze from a project with multi-item question batteries
- Weight: Apply demographic weighting → Silver
- Refine: Select the Silver dataset, then:
- Auto-suggested scale constructions appear for QuestionGroup batteries
- Click to quick-add, check Cronbach's alpha
- Add Top/Bottom Box for individual questions
- Create Gold with computed columns included
- Export: Download Gold with composite scores ready for SPSS
Multiple Deliverables
- Extract: Create Bronze dataset from project (all campaigns)
- Weight: Create Silver dataset with demographic correction
- Refine: Create Gold with recodes and computed scores
- Export from the bundle:
- Bronze as CSV for archival
- Silver as SPSS for methodological review
- Gold as Excel for client delivery
Integration
API Access
Programmatic access to Balansor functionality:
# List datasets
GET /api/v1/datasets

# Create dataset from campaign
POST /api/v1/datasets/extract
{
  "source_type": "campaign",
  "campaign_id": "uuid",
  "name": "Q1 2026 Responses",
  "include_demographics": true
}

# Apply weighting
POST /api/v1/datasets/weight
{
  "dataset_id": "bronze-uuid",
  "strategy_id": "strategy-uuid"
}

# Export dataset
GET /api/v1/datasets/{id}/export?format=csv
MCP Integration
For AI-assisted data analysis, Balansor operations are available through MCP (Model Context Protocol) tools covering dataset extraction, weighting, quality metrics, and export.
See the MCP Interface Reference for the complete list of available tools and their parameters.
Best Practices
Dataset Management
- Name datasets descriptively: Include campaign name, date, and stage
- Document processing steps: Use lineage tracking to maintain audit trail
- Archive Bronze datasets: Never delete raw data; it's your foundation
- Version your exports: Include timestamps in filenames
Weighting Strategy
- Define targets before collection: Better to weight to pre-defined targets
- Avoid extreme weights: Weights > 5.0 or < 0.2 indicate sampling problems
- Check convergence: Non-convergent raking suggests incompatible targets
- Review effective sample size: Significant reduction indicates over-correction
Quality Assurance
- Always check quality metrics before delivering weighted data
- Compare distributions before and after weighting
- Document any anomalies in export metadata
- Re-weight if targets change rather than adjusting existing weights
Export Strategy
- Match format to recipient: SPSS for statisticians, Excel for clients
- Include metadata for reproducibility
- Use consistent naming conventions across projects
- Keep export history for audit purposes
Troubleshooting
Common Issues
"No strategy assigned to this project"
The dataset's source project doesn't have a sampling strategy:
- Create a strategy in Targetor and assign it to the project
- Or select an organization-wide strategy for weighting
Raking did not converge
The algorithm couldn't find weights that match all targets simultaneously:
- Check if targets are mathematically achievable
- Review factor correlations (e.g., age-gender combinations)
- Consider relaxing target precision
- Verify sufficient respondents in each category
Low quality scores
Weighted data doesn't closely match targets:
- Check for missing demographic data in respondents
- Review target distributions against available population
- Consider if factors are too granular for sample size
Export fails
Dataset cannot be exported:
- Verify dataset isn't currently being processed
- Check file permissions and storage availability
- Try a different format (Parquet issues may not affect CSV)
Missing demographics in Bronze
Extracted dataset lacks demographic columns:
- Ensure "Include Demographics" was enabled during extraction
- Verify respondents have demographic data in Targetor
- Re-extract with demographics option enabled